Highlights from Chapter 7:
Forecasts and Estimates
This chapter provides the current forecasts and estimates related to the Silicon Valley to Central Valley and Phase 1 lines. These forecasts and estimates are developed pursuant to the Business Plan statutory requirements related to alternative financial scenarios. Areas covered in this chapter include high, medium and low scenarios for:
- Ridership and revenue forecasts
- Operations and maintenance (O&M) cost estimates
- Life cycle cost estimates
- Cash flow estimate
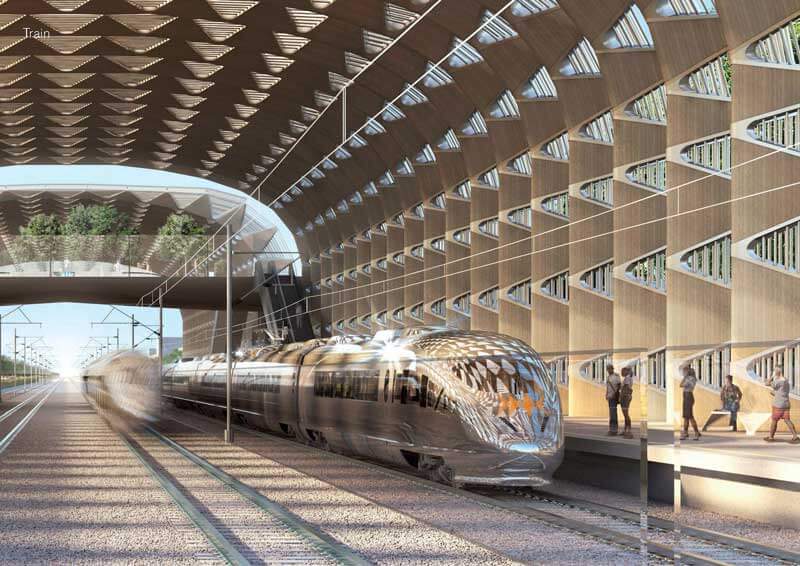
Simulation of riders awaiting a high-speed train
Key Facts
- By 2040, the system could carry 50 million riders per year and generate nearly $3.4 billion in farebox revenue each year
- At full operation, reduction of greenhouse gas emissions will be equivalent to removing 400,000 vehicles off the road and avoid consumption of 213 million gallons of gasoline
Breakeven Analysis Scenario – Phase 1 Opening Year (2033)

Description of the Phase 1 Opening Year (2033) information
Breakeven Analysis 2033
This chart displays the Breakeven Analysis on Phase 1 of the high-speed rail system assuming the opening year of 2033, showing an 83.3 percent probability that Phase 1 would be profitable between $0 to $1.6 billion and a 16.7 percent chance of deficit between $255 million and 0.
Breakeven Analysis Scenario – Silicon Valley to Central Valley Opening Year (2031)

Description of the Silicon Valley to Central Valley Opening Year (2031) information
Breakeven Analysis 2031
This chart displays the Breakeven Analysis on the Silicon Valley to Central Valley line assuming the opening year of 2031, showing a 71.3 percent probability that the Silicon Valley to Central Valley Line would be profitable between $0 to $90 million and a 28.7 percent chance of deficit between $20 million and 0.
Breakeven Analysis Scenario – Phase 1 Horizon Year (2040)

Description of the Phase 1 Horizon Year (2040) information
Breakeven Analysis 2040
This chart displays the Breakeven Analysis on Phase 1 of the high-speed rail system assuming the horizon year of 2040, showing a 99.4 percent probability that Phase 1 would be profitable between $0 to $5.7 billion and a 0.6 percent chance of deficit between $220 million and 0.
In the previous more detailed reviews of the modelling, we found the Authority’s ridership and revenue and O&M cost projection were produced using sound methodology which reflects industry best practice. Given the continuity of approach since 2016, this finding remains valid.
More Information
Learn more about the California High-Speed Rail program and business plan online at https://hsr.ca.gov/ or contact the Board of Directors at (916) 324-1541 or boardmembers@hsr.ca.gov.