Five rounded male and female stick figures in construction vests and hats. The text reads "Job-years supported from July 2006 through June 2025, Approximately 121,910 total program."

Nrog kev tsim kho tab, thiab kev hloov pauv ntawm California High-Speed Rail Authority los ntawm kev npaj rau lub phiaj xwm txhim kho phiaj xwm, cov txiaj ntsig kev lag luam ntawm cov haujlwm no nthuav dav ntxiv txhua xyoo. Pib nrog ob peb tus neeg ua haujlwm ntau dua kaum xyoo dhau los, tam sim no peb tes num txhawb nqa ntau txhiab txoj haujlwm ntawm txhua qhov haujlwm - los ntawm kev npaj thiab ib puag ncig kev qhia rau engineering thiab kev tsim kho. Txoj kev nqis peev no tau pab txhawb kev lag luam thoob plaws California thiab thoob plaws teb chaws.

Kev nqis peev nyob rau hauv txoj kev tsheb ciav hlau siab yog txhawb cov haujlwm, cov nyiaj tau los ntawm cov neeg ua haujlwm thiab cov nyiaj txiag tsim tawm thoob plaws ntau lub xeev California.

Learn more about the approximately $14.6 billion invested in the nation’s first high-speed rail system over the past decade and more.

Kev nqis peev hauv California Txoj Kev Lag Luam

About 98.6% of the investment between July 2006 and June 2025 led to economic activity taking place within the state of California, with spending going to firms and workers based in the state.

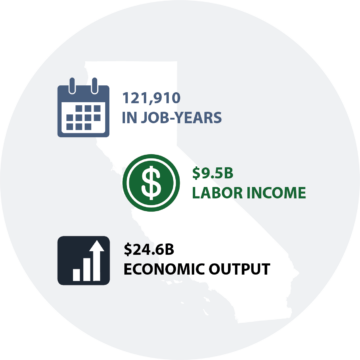
California Qhov Cuam Tshuam

JULY 2006 to JUNE 2025

Image of California with a calendar, dollar sign, and bar graph on it. Next to the calendar, it says "121,910 in job-years." Next to the dollar sign it says "$9.5B labor income. Next to the bar graph it says "$24.6B Economic Output."

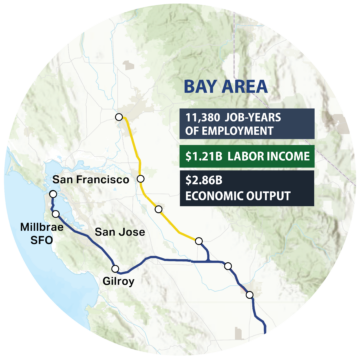
Bay Area Regional Economic cuam tshuam

JULY 2006 to JUNE 2025

Map of Northern California showing the Phase 1 high-speed rail alignment in blue and the Phase 2 alignment in yellow. The text reads

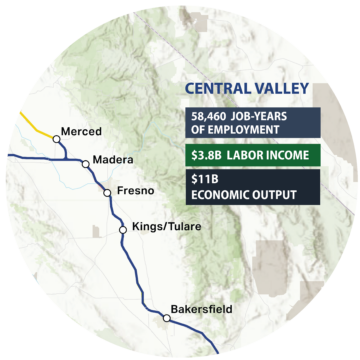
Central Valley Regional Economic cuam tshuam

JULY 2006 to JUNE 2025

Central Valley, 58,460 Job-Years of Employment, $3.8B Labor Income, $11B Economic Output, map of the Central Valley with the high-speed rail alignment.

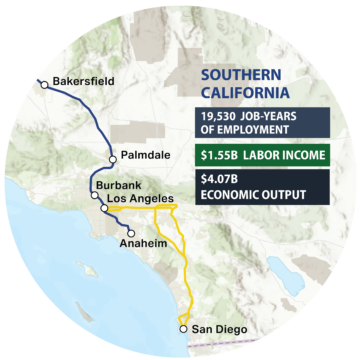
Southern California Regional Economic Impact

JULY 2006 to JUNE 2025

Southern California, 19,530 Job-Years of Employment, $1.55B Labor Income, $4.07B Economic Output, map of the Southern California from Bakersfield to San Diego with the high-speed rail alignment.

Kev nqis peev hauv Peb Tebchaws

Map of the United States with states in green and blue. North Dakota, South Dakota, Arkansas, Mississippi, West Virginia, New Hampshire, and Rhode Island are colored in blue. The rest of the country is in green. The text reads "National impact companies from 43 states involved in High-Speed Rail."
Calendar that says July 2006 with an arrow pointing right filled with $14.6 Billion towards June 2025. The text reads "$14.6 Billion Invested" and "98.6% went to California Firms and Workers."
Xeev California Txoj Kev Loj Ciav Hlau ua txhua yam kom xyuas tau lub vev xaib thiab nws cov lus qhia ua tau raws li tsab cai ADA raws li Xeev California Txoj Cai Kev Nkag mus Nkag Siab Cov Lus Qhia Ua Ntej 2.0 Theem tus qauv. Yog tias koj tab tom nrhiav ib daim ntawv tshwj xeeb tsis nyob hauv California Daim Ntawv Ceev Cov Hluav Taws Xob Tsav Tsheb Ceev lub vev xaib, koj tuaj yeem thov cov ntawv no nyob rau hauv Cov Ntaub Ntawv Kev Ceev Ntaub Ntawv los ntawm Pej Xeem Cov Ntaub Ntawv Cov Cai. Yog tias koj muaj lus nug dab tsi txog lub vev xaib lossis nws cov ntsiab lus, thov hu rau Tus Thawj Coj ntawm info@hsr.ca.gov.