
With construction underway, and the transition of the California High-Speed Rail Authority from a planning to a project development organization, the economic benefit of these activities is substantially growing every year. Starting with just a few employees over a decade ago, the project now supports thousands of jobs across all functions—from planning and environmental clearance to engineering and construction. This investment has spurred economic benefits around California and across the country.
Investment in high-speed rail is supporting jobs, labor income and economic output across a number of California’s regions.
Learn more about the approximately $11.2 billion invested in the nation’s first high-speed rail system over the past decade and more.
Investing in California’s Economy
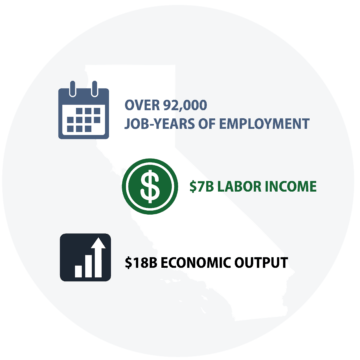
About 97% of the investment between July 2006 and June 2023 led to economic activity taking place within the state of California, with spending going to firms and workers based in the state.
California Economic Impact
JULY 2006 – JUNE 2023
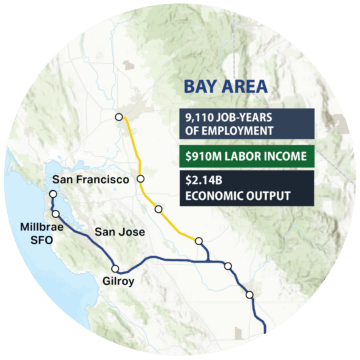
Bay Area Regional Economic Impact
JULY 2006 – JUNE 2023
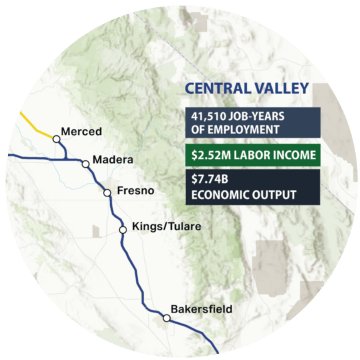
Central Valley Regional Economic Impact
JULY 2006 – JUNE 2023
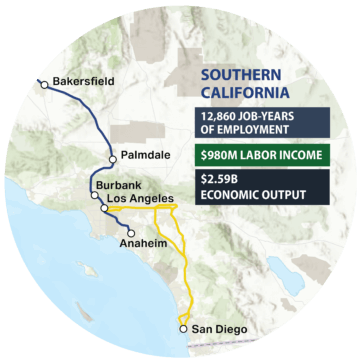
Southern California Regional Economic Impact
JULY 2006 – JUNE 2023
Investing in Our Nation
To date, $6.8 billion in funding has come from Federal Sources, infusing the state’s economy with federal dollars. To date, companies from 43 states and the District of Columbia have been involved in high-speed rail.


The California High-Speed Rail Authority makes every effort to ensure the website and its contents meet mandated ADA requirements as per the California State mandated Web Content Accessibility Guidelines 2.0 Level AA standard. If you are looking for a particular document not located on the California High-Speed Rail Authority website, you may make a request for the document under the Public Records Act through the Public Records Act page. If you have any questions about the website or its contents, please contact the Authority at info@hsr.ca.gov.