Five rounded male and female stick figures in construction vests and hats. The text reads "Job-years supported from July 2006 through June 2025, Approximately 121,910 total program."

With construction underway, and the transition of the California High-Speed Rail Authority from a planning to a project development organization, the economic benefit of these activities is substantially growing every year. Starting with just a few employees over a decade ago, the project now supports thousands of jobs across all functions—from planning and environmental clearance to engineering and construction. This investment has spurred economic benefits around California and across the country.

Investment in high-speed rail is supporting jobs, labor income and economic output across a number of California’s regions.

Learn more about the approximately $14.6 billion invested in the nation’s first high-speed rail system over the past decade and more.

Investing in California’s Economy

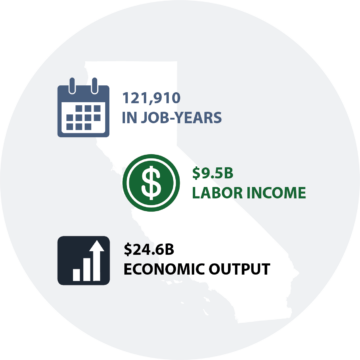
About 98.6% of the investment between July 2006 and June 2025 led to economic activity taking place within the state of California, with spending going to firms and workers based in the state.

California Economic Impact

JULY 2006 to JUNE 2025

Image of California with a calendar, dollar sign, and bar graph on it. Next to the calendar, it says "121,910 in job-years." Next to the dollar sign it says "$9.5B labor income. Next to the bar graph it says "$24.6B Economic Output."

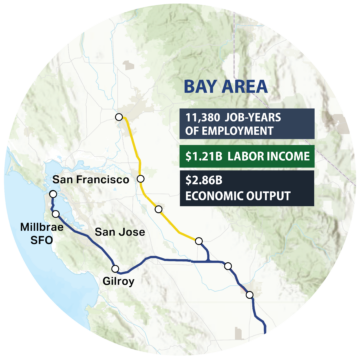
Bay Area Regional Economic Impact

JULY 2006 to JUNE 2025

Map of Northern California showing the Phase 1 high-speed rail alignment in blue and the Phase 2 alignment in yellow. The text reads

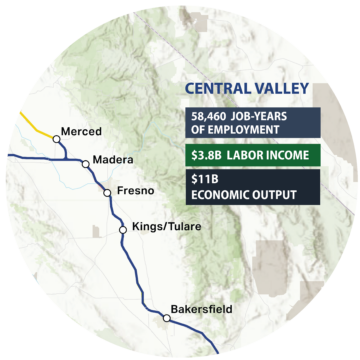
Central Valley Regional Economic Impact

JULY 2006 to JUNE 2025

Central Valley, 58,460 Job-Years of Employment, $3.8B Labor Income, $11B Economic Output, map of the Central Valley with the high-speed rail alignment.

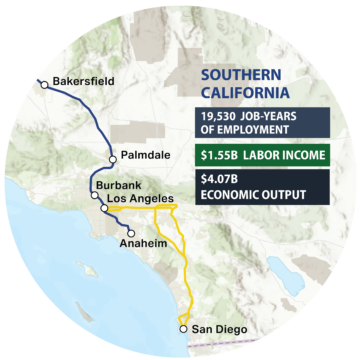
Southern California Regional Economic Impact

JULY 2006 to JUNE 2025

Southern California, 19,530 Job-Years of Employment, $1.55B Labor Income, $4.07B Economic Output, map of the Southern California from Bakersfield to San Diego with the high-speed rail alignment.

Investing in Our Nation

Map of the United States with states in green and blue. North Dakota, South Dakota, Arkansas, Mississippi, West Virginia, New Hampshire, and Rhode Island are colored in blue. The rest of the country is in green. The text reads "National impact companies from 43 states involved in High-Speed Rail."
Calendar that says July 2006 with an arrow pointing right filled with $14.6 Billion towards June 2025. The text reads "$14.6 Billion Invested" and "98.6% went to California Firms and Workers."
The California High-Speed Rail Authority makes every effort to ensure the website and its contents meet mandated ADA requirements as per the California State mandated Web Content Accessibility Guidelines 2.0 Level AA standard. If you are looking for a particular document not located on the California High-Speed Rail Authority website, you may make a request for the document under the Public Records Act through the Public Records Act page. If you have any questions about the website or its contents, please contact the Authority at info@hsr.ca.gov.